
Costly Oak Markets
PhD Research in Financial Market Learning and Price Discovery: Macro Theory and Market Microstructure Theory
Live Trading Results
5 Years of Experience in Live Markets - Applying ideas on pockets of inefficient price delivery
Market Ideas
The Efficient Market Hypothesis (EMH), dominant since the 1960s, holds that asset prices fully reflect available information, leaving little scope for systematic edge. Yet this view largely abstracts from how prices are actually delivered in modern markets.In practice, price discovery is not instantaneous or frictionless. Markets often leave behind “signatures” — recurring patterns where price accelerates, overshoots, and then returns to re-test specific levels before continuing. These signatures may reflect information being incorporated into prices, but they also reveal the mechanics of the price delivery process: liquidity gaps, order-matching rules, and algorithmic feedback loops.What emerges is a picture where markets may be informationally efficient in the EMH sense, yet structurally inefficient in the short run. The delivery of prices can be uneven, creating temporary inefficiencies that repeat with surprising regularity. These dynamics blur the line between EMH and microstructure, suggesting that efficiency is not a static state but a process — one in which short-term rebounds into “unfinished” price pockets are an essential part of how markets reach equilibrium.
EMH has dominated for 60+ years
Explains information efficiency, but not how prices are delivered
Repeated signatures show efficiency is a process, not an instant fact
Structural frictions can create daily, observable inefficiencies
Contact and CV
Theories
This project re-examines high-frequency identification of monetary policy shocks. Standard designs rely on fixed event windows around announcements to isolate the “surprise” component, but they implicitly assume the market’s adjustment completes within that preset clock. In practice, execution frictions and liquidity conditions can stage the response, so a fixed window can capture only part of the move or pick up unrelated noise, distorting the measured shock.I propose a liquidity-aware dynamic event window that adapts to market conditions in real time. Operationally, the window closes when bid–ask spreads and depth normalise towards pre-event baselines and when the initial impulse region is revisited—signals that the mechanical delivery of prices has largely run its course. A simple Time-to-Delivery (TTD) metric captures how long this takes, ensuring the identification reflects both the informational move and the short-run delivery phase.By aligning the window to observable market mechanics, the resulting shock series is cleaner and more comparable across regimes, improving downstream impulse responses and transmission estimates in rates, equities and FX. The framework is deliberately practical—implementable with standard L1 microstructure data—and readily extends to other macro shocks (e.g., oil and carbon), where the relevant window may range from seconds to hours depending on liquidity and uncertainty conditions.Selected references: Gürkaynak, Sack & Swanson (2005); Jarociński & Karadi (2020); Miranda-Agrippino & Ricco (2021); Veronesi (2002).
My Projects
Costly Oak Markets All Rights Reserved
Aidan Yates
PhD Student
Proprietary and Live Futures Trader
🇬🇧 UK DISCLAIMER (FCA COMPLIANCE)Educational Content Only – No Personal Advice
This material is provided for educational and demonstration purposes only. It is not intended to be, nor should it be construed as, financial advice or a personal recommendation to buy, sell or hold any financial instrument. Nothing in this material takes into account your individual objectives, financial situation or needs. You should not rely on it for making any investment decisions.Regulatory Status
We are not authorised by the Financial Conduct Authority to provide personal advice or recommendations. All content is produced independently of any broker or product provider, and we do not receive commissions or other remuneration linked to any trades you may undertake.Risk Warnings
• Trading and investing carry a high degree of risk. You may incur losses, including the loss of your entire capital.
• Past performance is not a reliable indicator of future results. The value of investments and the income derived from them can fall as well as rise.
• You may get back less than you invested, and in extreme cases, receive nothing at all.
• You should only trade with funds you can afford to lose.Suitability & Independent Advice
This content is not tailored to your personal circumstances. Before acting on any information, you should consider seeking independent financial advice from an FCA-authorised adviser.Demo Account Simulations
Any examples shown using real-time demo (simulated) trading accounts are for illustration only. Simulated performance does not involve real money and cannot replicate actual market conditions, slippage, liquidity constraints or emotional pressures. Consequently, demo results may differ materially from the results you achieve with real funds.⸻🇺🇸 US DISCLAIMER (CFTC / NFA COMPLIANCE)Educational Purposes Only – Not Investment Advice
All content, including live demonstrations using simulated (“demo”) accounts, is provided solely for educational and illustrative purposes and does not constitute an offer or solicitation to buy or sell any commodity interest, security or other financial instrument. It is not intended as, nor should it be construed as, personalised investment advice.Risk Disclosure
• Trading futures, forex, options and other leveraged instruments entails substantial risk and is not suitable for all investors.
• You may lose some or all of your invested capital.
• Past performance (actual or hypothetical) is not indicative of future results.Hypothetical Performance Disclaimer
The following statement is provided in accordance with CFTC Regulation 4.41 and NFA Compliance Rule 2-29, and must be displayed prominently alongside any hypothetical or simulated performance data:“HYPOTHETICAL PERFORMANCE RESULTS HAVE MANY INHERENT LIMITATIONS, SOME OF WHICH ARE DESCRIBED BELOW. NO REPRESENTATION IS BEING MADE THAT ANY ACCOUNT WILL OR IS LIKELY TO ACHIEVE PROFITS OR LOSSES SIMILAR TO THOSE SHOWN.ONE OF THE LIMITATIONS OF HYPOTHETICAL PERFORMANCE RESULTS IS THAT THEY ARE GENERALLY PREPARED WITH THE BENEFIT OF HINDSIGHT. IN ADDITION, HYPOTHETICAL TRADING DOES NOT INVOLVE FINANCIAL RISK, AND NO HYPOTHETICAL TRADING RECORD CAN COMPLETELY ACCOUNT FOR THE IMPACT OF FINANCIAL RISK IN ACTUAL TRADING. FOR EXAMPLE, THE ABILITY TO WITHSTAND LOSSES OR ADHERE TO A PARTICULAR TRADING PROGRAM IN SPITE OF ADVERSE MARKET CONDITIONS OR LACK OF LIQUIDITY MAY ADVERSELY AFFECT ACTUAL TRADING RESULTS.FURTHERMORE, HYPOTHETICAL TRADING PROGRAMS IN GENERAL ARE ALSO SUBJECT TO THE FACT THAT THEY ARE DESIGNED WITH THE BENEFIT OF HINDSIGHT. THERE ARE NUMEROUS OTHER FACTORS RELATED TO THE MARKETS IN GENERAL OR TO THE IMPLEMENTATION OF ANY SPECIFIC TRADING PROGRAM WHICH CANNOT BE FULLY ACCOUNTED FOR IN THE PREPARATION OF HYPOTHETICAL RESULTS AND ALL OF WHICH CAN ADVERSELY AFFECT ACTUAL TRADING RESULTS.NO REPRESENTATION IS BEING MADE THAT ANY ACCOUNT WILL OR IS LIKELY TO ACHIEVE PROFITS OR LOSSES SIMILAR TO THOSE SHOWN. PAST RESULTS ARE NOT NECESSARILY INDICATIVE OF FUTURE RESULTS AND ACTUAL PERFORMANCE MAY VARY MATERIALLY.”Important Notes on Hypothetical / Simulated Trading
• Simulations are performed on demo accounts and do not involve real financial exposure.
• They cannot replicate market slippage, latency, order rejections, liquidity constraints or emotional factors.
• No simulation can fully account for the impact of risk management under live conditions.
• Performance figures—whether actual or hypothetical—should not be interpreted as guarantees of future financial results.Independent Responsibility
You alone are responsible for verifying and understanding the risks associated with any strategy. Consult a registered financial professional if you have questions about your personal financial circumstances.⸻🌐 GLOBAL / UNIVERSAL DISCLAIMERGeneral Educational Notice
This content is provided for general information and educational purposes only, to audiences in the UK, the US and elsewhere. It does not constitute financial advice, a personal recommendation or an offer to buy or sell any financial instrument.Risk & Performance Warnings
• Trading carries risk: you could lose all your invested capital.
• Past performance (actual or simulated) is not indicative of future results.
• Demo account examples are purely illustrative; they do not reflect real-world trading conditions or emotional pressures.
• You should only trade with funds you can afford to lose and seek independent professional advice if uncertain.By accessing or using any of our materials, you acknowledge your understanding of these disclaimers and agree that we bear no responsibility for any trading decisions you make.⸻References / Links
• FCA Conduct of Business Sourcebook (COBS)
https://www.handbook.fca.org.uk/handbook/COBS/
• FCA Finalised Guidance FG15/1 (Past Performance)
https://www.fca.org.uk/publications/finalised-guidance/fg15-01
• FCA Policy Statement PS22/10 (Suitability Guidance)
https://www.fca.org.uk/publications/policy-statements/ps22-10
• CFTC Regulation 4.41 (Hypothetical Performance Disclosures)
https://www.ecfr.gov/current/title-17/chapter-I/part-4/subpart-B/section-4.41
• NFA Compliance Rule 2-29 (Hypothetical Performance Disclosure)
https://www.nfa.futures.org/rulebook/rule2-29.html
Returning back to Inefficient Pockets
OverviewThis study investigates the behaviour of inefficiency pockets in intraday price data small, short-lived microstructure gaps created during rapid one-sided price movements. These structures resemble what some trading theorists informally reference as “untraded voids”, “inefficiencies”, or “price delivery gaps”. The aim of this empirical exercise is not to prove a trading edge, but to examine whether such structures tend to be revisited within a measurable time horizon when observed through a formal, reproducible rule set.Instrument: NASDAQ futures (continuous contract, one-minute bars)Period: Full 2024 Year
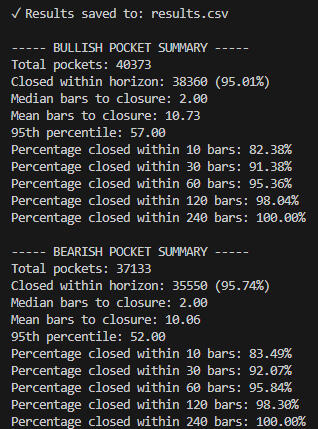
InterpretationThe results display two clear characteristics:Inefficiency pockets form frequently, suggesting they are a regular part of the intraday price formation process rather than a rare anomaly.The vast majority are revisited relatively quickly, with a median closure of only two bars and more than 82% resolving within ten bars.These findings appear difficult to reconcile with a naïve random-walk or memoryless price-path assumption, as such a process would not be expected to display strong, fast, and highly consistent return behaviour to microstructure-defined zones. The high closure rates across both bullish and bearish conditions also suggest symmetry in underlying mechanism rather than directional bias.While this study does not assert causation, predictability, or tradability, it does raise legitimate structural questions regarding how price delivery, order flow imbalance, and information absorption may interact within short-horizon market microstructure.
Select out of 2 mentorship options to suit different levels of commitment and focus. Select the option that best aligns with your goals.
• Core Mentorship – £2000
• Advanced Mentorship – £2000
📘 What You’ll Receive:Core Mentorship: Designed for beginners - goal is to be able to learn enough to be able to create and trade profitable personal trading models without help
Please include in the form:
• Full Name
• Email Address
• Telegram Username
• Trading Experience (briefly describe)
• What do you want to gain from mentorship?
• Preferred Start Date